23 Hrs
المصدر:
معلومات مباشر
معلومات مباشر
جاهز للتشغيل
جاهز للتشغيل
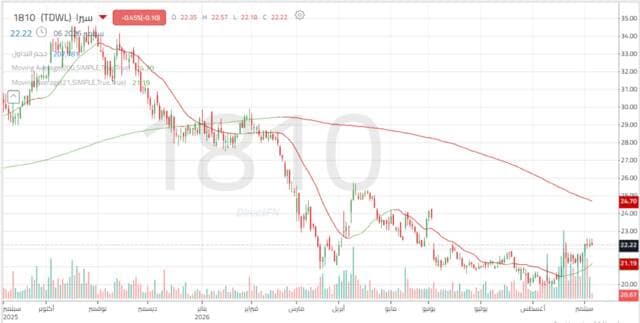
Sira Capital Group's stock (symbol 1810) has undergone significant technical shifts, as the stock broke above the upper boundary of the descending wedge pattern. This pattern is considered a reversal indicator, suggesting a potential shift from a downtrend to an uptrend. The breakout came after a period of narrowing trading range, indicating reduced selling pressure and the stock's readiness to move higher. The price is targeting resistance levels around 22.48 SAR. With stability above this level and increased trading volume, the stock could aim for levels between 23.00 and 23.50 SAR, possibly surpassing them to reach a range between 24.30 and 25.00 SAR. Maintaining the price above a key support level at 21.67 SAR supports a positive outlook for the stock and reduces the chances of a decline. Since the beginning of 2026, the stock has traded within a sideways range that started in January after a sharp drop in October of the previous year. It broke below the support of 25.00 SAR, reaching a major support at 20.70 SAR. In March, the stock began a recovery phase, moving within a range between support at 19.05 SAR and resistance at 23.54 SAR, with fluctuations in buying and selling pressures.
تنويه: هذا ملخص تم إنشاؤه بواسطة الذكاء الاصطناعي






comments.heading